How to create a customizable Email Performance Report as a Marketing Cloud App
As we all know the reports are not one of the better features in Marketing Cloud. In my opinion, they are not particularly beautiful, powerful or user-friendly. So I decided to create my own email performance report using a cloudpage and make it accessible as an Marketing Cloud app via the AppExchange menu.
Here is what I have done:
1. Prepare a cloudpage to show the email performance report
2. Create a process to update the data extension with email performance data
3. Secure the cloudpage for internal access only
4. Connect the cloudpage as a Marketing Cloud app
1. Prepare a cloudpage to show the email performance report
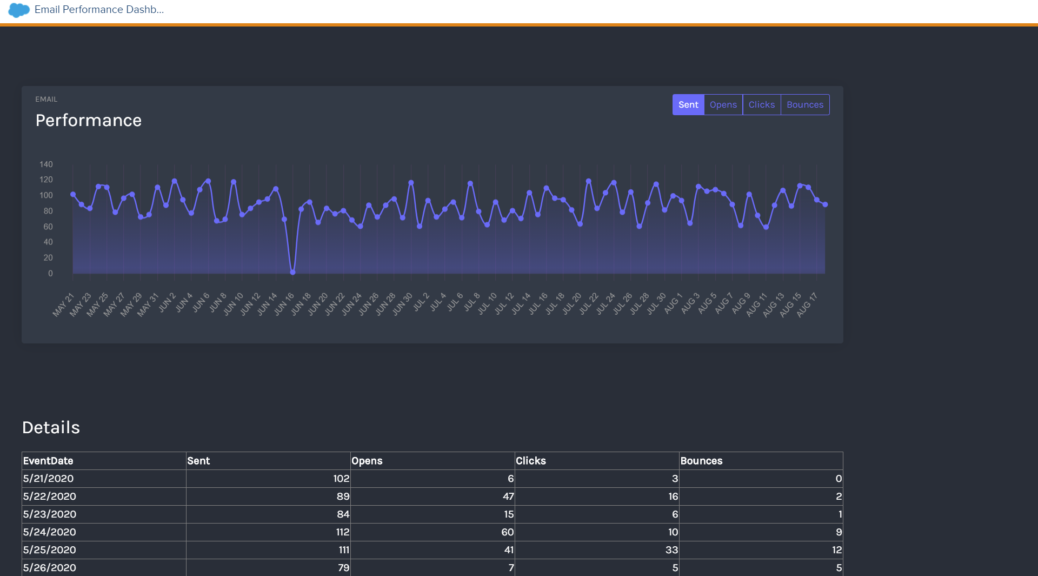
The first step is to get an idea what I want to show the users on the cloudpage. I decided to go for a chart and a table showing the emails of the last 90 days. So I did some research for a javascript library I can use for a chart and found the open source javascript library chart.js on https://www.chartjs.org/. This should be it. Next question was how to get the data I have in data views or data extensions into this chart. Therefore I found this awesome post by Jason Hanshaw: https://invokecreate.dev/visualize-data-extension-with-chartjs.

Using his instructions we have these resources for our cloudpage:

And our data extension:

Now we have the chart and a source data extension as the basis of our report. In addition I added the data as a table on the cloudpage using a lookuprows function and an additional field “count” in the data extension.

Here is the HTML code and AMPScript I added:
<h2 class="hdetails">Details</h2>
<table class="tdetails">
<tr class="bold">
<td>EventDate</td>
<td>Sent</td>
<td>Opens</td>
<td>Clicks</td>
<td>Bounces</td>
</tr>
%%[
set @rows = lookuprows("Email_Report_Cloudpage_Data", "count", 1)
if rowcount(@rows) > 0 then
for @i=1 to rowcount(@rows) do
set @row = Row(@rows, @i)
set @eventDate = field(@row, "eventDate")
set @eventDate = Substring(@eventDate,1, Subtract(IndexOf(@eventDate," "),1))
set @sent = field(@row, "sent")
set @opens = field(@row, "opens")
set @clicks = field(@row, "clicks")
set @bounces = field(@row, "bounces")
]%%
<tr>
<td>%%=v(@eventDate)=%%</td>
<td class="tright">%%=v(@sent)=%%</td>
<td class="tright">%%=v(@opens)=%%</td>
<td class="tright">%%=v(@clicks)=%%</td>
<td class="tright">%%=v(@bounces)=%%</td>
</tr>
%%[
next @i
else
endif
]%%
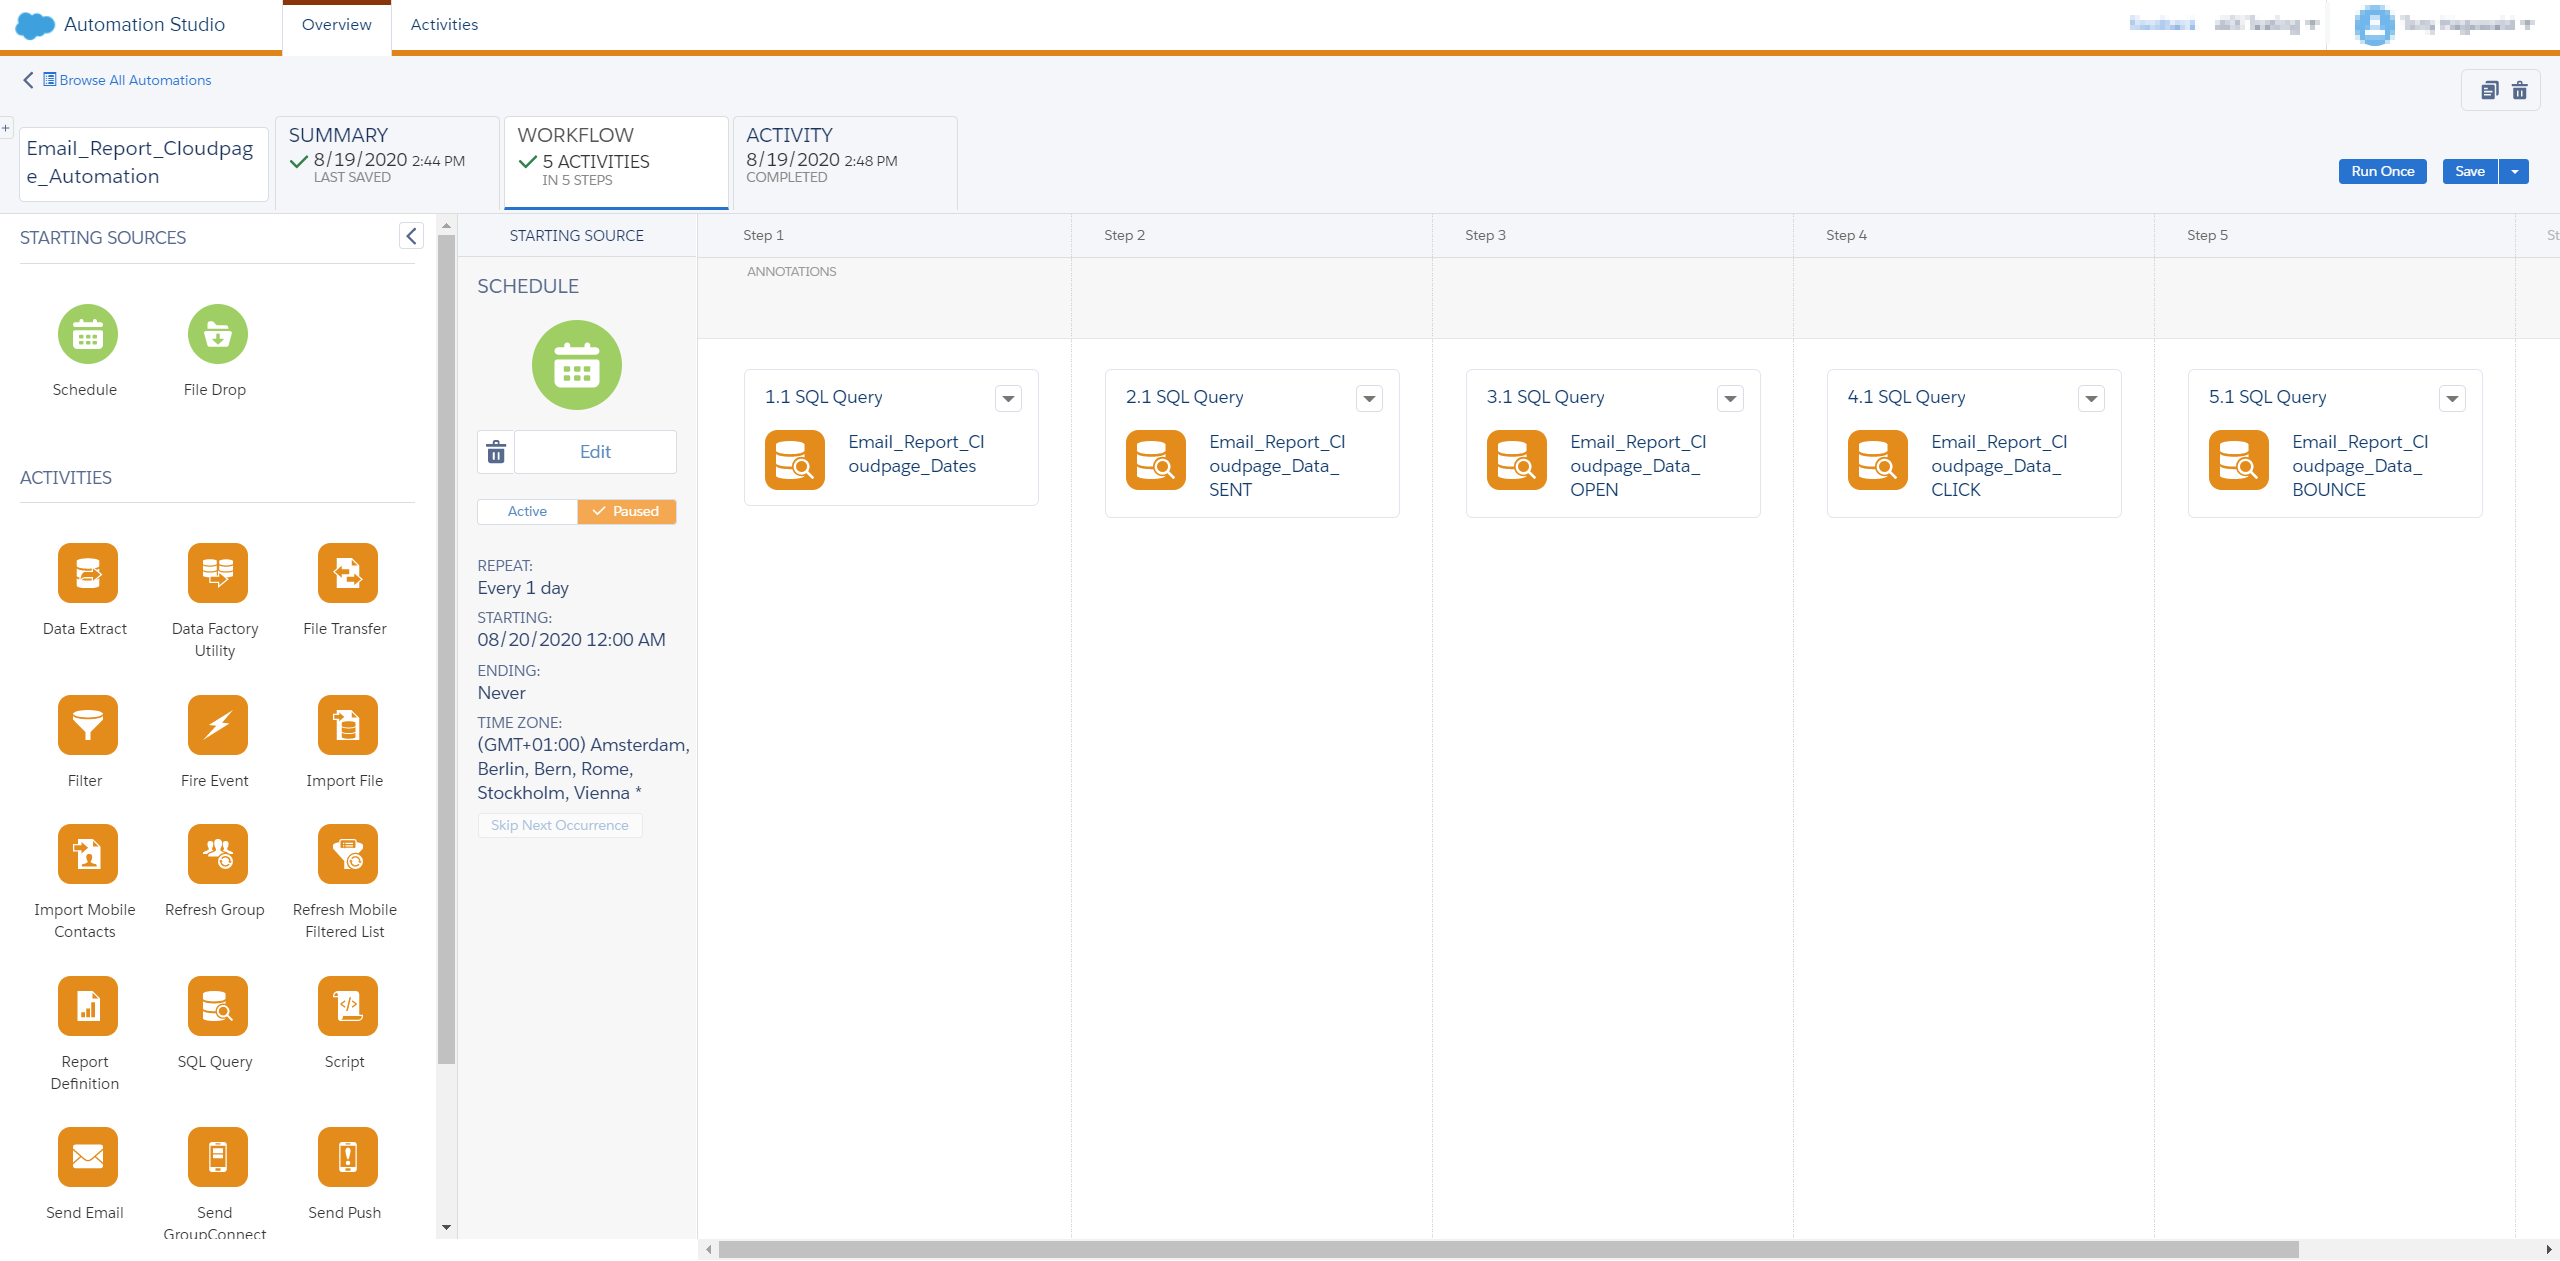
</table> 2. Create a process to update the data extension with email performance data
Now we want to get the actual email data into a data extension. As mentioned the report should cover the last 90 days and will show the daily volume of sends, opens, clicks and bounces. The easiest way to do this is to use an Automation. The data view records are easy to count, so I will just paste the sql in the following. The more interesting task is to get one record for every day, also if there were no records to count. Because of the limitations of Marketing Cloud SQL I decided to use a help data extension that will have the same number of rows as I want to have in my report data extension.

Now I can use the row_number() function to create one record for every day I want to show in the report. Furthermore I use this query to fill the other fields with a zero, so I do not get any empty record fields and empty spaces in the chart.

SELECT
convert(date, DateAdd(Day, (ROW_NUMBER() OVER (ORDER BY _CustomObjectKey)-91),GetDate()))
as EventDate, 0 as sent, 0 as opens, 0 as clicks, 0 as bounces, 1 as count
FROM [Email_Report_Cloudpage_Rowcount]
Afterwards I replace the zero values with the real email data (use update data action).
SELECT COUNT(*) as sent, convert(date, EventDate) as EventDate
FROM _sent
WHERE EventDate > dateadd(day,-90,getdate()) '
GROUP BY convert(date, EventDate)
SELECT COUNT(*) as opens, convert(date, EventDate) as EventDate
FROM _open
WHERE EventDate > dateadd(day,-90,getdate()) AND IsUnique = 'true'
GROUP BY convert(date, EventDate)
SELECT COUNT(*) as clicks, convert(date, EventDate) as EventDate
FROM _click
WHERE EventDate > dateadd(day,-90,getdate()) AND IsUnique = 'true'
GROUP BY convert(date, EventDate)
SELECT COUNT(*) as bounces, convert(date, EventDate) as EventDate
FROM _bounce
WHERE EventDate > dateadd(day,-90,getdate()) AND IsUnique = 'true'
GROUP BY convert(date, EventDate)
Altogether we have our automation ready and schedule it daily. It is of course possible to set other time periods and more frequent runs but for my case this is alright.
As a result we get our completely filled Data Extension:

3. Secure the cloudpage for internal access only
Now that the cloudpage is live and showing our data, we want to make it more secure and save it from external access. Since we use a fixed IP address in our company, I decided that an IP Address Whitelist would be the best way. Thanks to great blogs on the internet this is also a function I do not need to build from scratch. I just used the IP Whitelist script Markus describes here:
https://markus.codes/2020/05/25/securing-cloudpages-with-ssjs-in-salesforce-marketing-cloud
4. Connect the cloudpage as a Marketing Cloud app
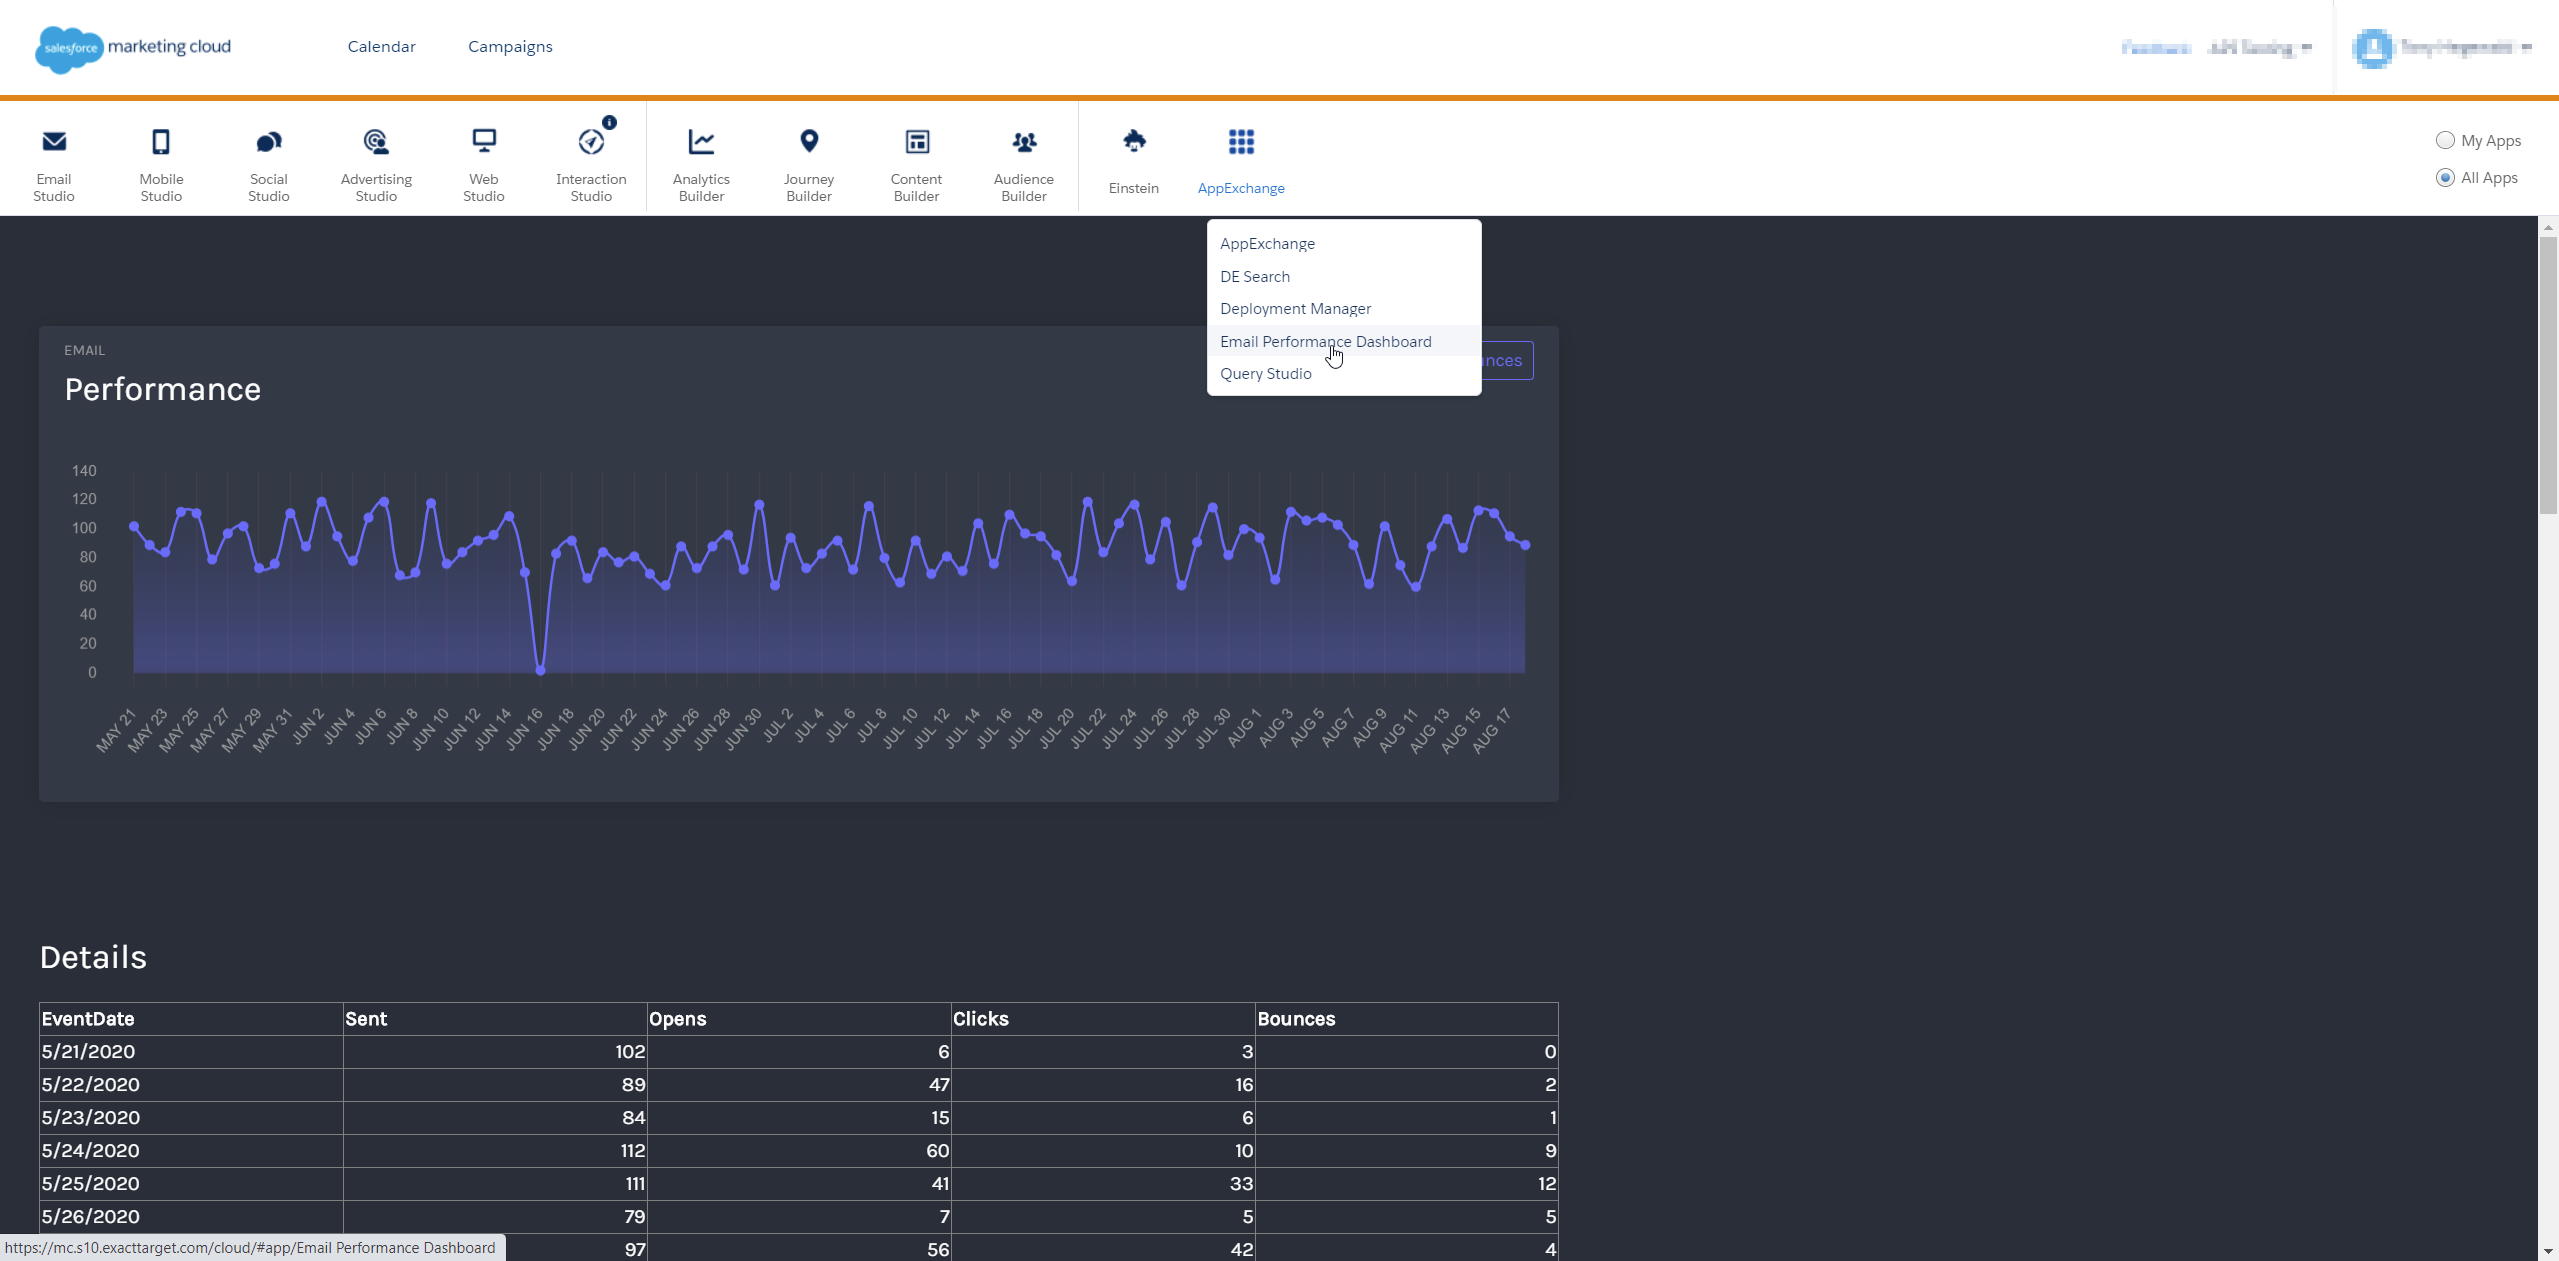
As the last step for now, I decided to include the cloudpage as an Marketing Cloud App in the main menu. Therefore I created an installed package, defined the cloudpage as the endpoints and gave all users access to the package.

Finished this, we are able to access the cloudpage from the AppExchange menu.
So that´s our easily accessible email report on a cloudpage, connected as an Marketing Cloud App. Maybe I will enhance it to show different time frames or specific journeys and emails. Thinking about using this cloudpage in a customer instance, you could also adapt the style to the customer’s CI or display the company logo on the page. This is just one example of how easy it is to create your own reports and make them available to users. Do you have other ideas for improvements? Let me know in the comments.
3 thoughts on “How to create a customizable Email Performance Report as a Marketing Cloud App”
Comments are closed.